Power BI is a collection of software services, apps, and connectors that work together to turn your unrelated sources of data into coherent, visually immersive, and interactive insights. Your data may be an Excel spreadsheet, or a collection of cloud-based and on-premises hybrid data warehouses. Power BI lets you easily connect to your data sources, visualize and discover what’s important, and share that with anyone or everyone you want.
Objectives
How Power BI matches your role
If you're a developer, you might use Power BI APIs to push data into datasets or to embed dashboards and reports into your own custom applications. Have an idea for a new visual? Build it yourself and share it with others.
You also might use each element of Power BI at different times, depending on what you’re trying to achieve or your role for a given project.
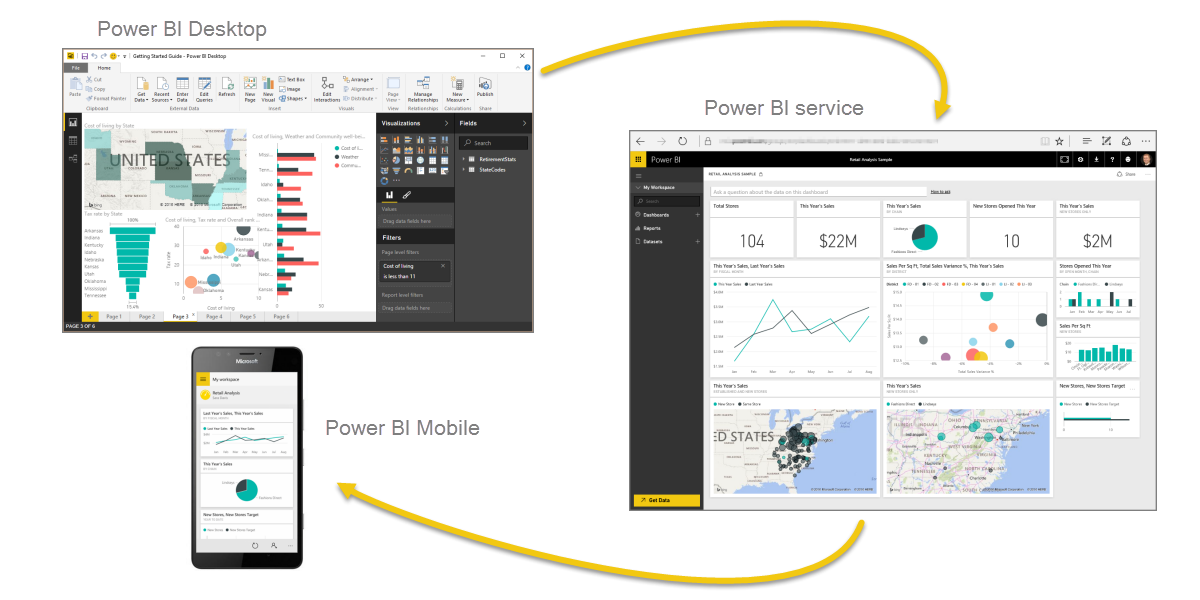
How you use Power BI can be based on which feature or service of Power BI is the best tool for your situation. For example, you can use Power BI Desktop to create reports for your own team about customer engagement statistics and you can view inventory and manufacturing progress in a real-time dashboard in the Power BI service. Each part of Power BI is available to you, which is why it’s so flexible and compelling.
Parts of Power BI
Contact us

Vishnu Vardhan

Maheshwari
Reviews
Our Rating
Quality
Outstanding
Puncuality
Outstanding
Responsibility
Outstanding
Vishnu Vardhan
Datalics provides Top notch IT Training, Analytic courses, Programming Language courses to all graduates.
Maheshwari
Datalics provides Top notch IT Training, Analytic courses, Programming Language courses to all graduates.
Sujatha Reddy
Datalics provides Top notch IT Training, Analytic courses, Programming Language courses to all graduates.